PTE Describe Image Questions: Complete Guide, Templates & High-Scoring Strategies
19 July 2026
To get high marks in the Speaking module of the Pearson Test of English, you need much more than fluency in English alone. You must use certain structured approaches and fast techniques that can help you cope with the task of pte describe image questions, which is quite challenging.
The following guide will show you how to cope with the Describe Image task. Here you will learn all about the criteria used by examiners for marking this task. In addition, you will be provided with the types of Describe Image questions and the template that should be used in order to describe any visual.

Understanding the PTE Describe Image Scoring Criteria
In order to achieve a high score in the PTE Describe Image questions, it is essential to know how your audio recording is analyzed by the computer scoring system at Pearson. There is no use of human examiners in the Speaking section; rather, an extremely advanced scoring engine is used. There are basically three criteria on which your speaking score is evaluated.
| Scoring Criterion | Maximum Points | What the AI Evaluates | Key Focus Area |
| Oral Fluency | 5 Points | Smoothness of speech, natural phrasing, rhythm, and lack of hesitations or false starts. | Maintain a continuous flow of speech without long pauses. |
| Pronunciation | 5 Points | Correct word stress, clear vowel and consonant sounds, and natural sentence intonation. | Speak clearly at a moderate volume and natural pace. |
| Content | 5 Points | Inclusion of key facts, titles, labels, extreme values, trends, and relationships. | Use relevant keywords from the image to satisfy the algorithm. |
It is a common misconception among test takers that Content is the most important aspect of this question. But in the computer-based PTE Speaking section, both Oral Fluency and Pronunciation are very significant. When you hesitate, stumble or pause to find the right word, your Oral Fluency scores will get affected severely.
Types of PTE Describe Image Questions You May Encounter
The PTE exam presents various visual formats. You cannot predict which type of graphic will appear on your screen on exam day. Therefore, you must familiarize yourself with all possible variations of pte describe image questions.
Bar Charts
Bar graphs are some of the most used graphics on the test. They show information through bars which have a length that is proportional to the value of the item. There are horizontal and vertical bar graphs, and you may also come across grouped or stacked bar graphs.
The important things to note while interpreting a bar graph include:
- The title and unit of measurement.
- The X-axis (items) and Y-axis (values/percents).
- The tallest and shortest bars.
- The clear contrasts or comparisons of the values.
Line Graphs
A line graph represents information in the form of dots connected through straight lines. It is mainly used to indicate a trend or fluctuation within a certain period of time.
When describing a line graph, you should pay attention to:
- Starting and ending points of the timeline.
- Key points such as peaks and troughs.
- General trends, such as a steady increase, a sharp decline, or a period of stability.
- Sharp fluctuations or unexpected drops in the line.
Pie Charts
Pie charts depict information through sections of a circle, demonstrating numerical relationships. The whole circle depicts 100% while the sections represent sizes of certain categories. Some facts to obtain from a pie chart are:
- The category that has the largest percentage of the pie (largest section of the circle).
- The category that has the smallest percentage of the pie (smallest section of the circle).
- Certain percentages of the main sections.
- Any categories that are equal or nearly equal in size.
Tables
Table contains data that is systematically organized into rows and columns. Though tables do not have curves like graphs do, they have very accurate numeric data. While looking at the table, do not try to look at all the numbers. Rather, you should look for:
- The headings of the rows and columns.
- The maximum and minimum numbers in the data set.
- Any patterns in the data set, like an increasing or decreasing column.
- Any average or total at the end or side of the data set.
Process Diagrams
Process diagram describes stages, steps or events in a process. It could describe biological cycles like the water cycle, life cycle of frogs or industrial manufacturing process like the production of cement or recycling of papers. Things you need to consider when dealing with process diagram:
- Starting point or beginning material.
- Total number of steps or stages in the process.
- Final product or stage.
- Arrows that show the direction of the process.
Maps
Maps show geographical regions, sometimes showing contrast between past and present times, population trends, weather trends, and even infrastructure. Some of the things that you should consider when analyzing a map include:
- The place or area that is depicted by the map.
- The various features in the map’s key (forests, roads, buildings, etc.)
- The directions shown by compass directions (North, South, East, and West).
- Contrasts in the various spatial areas (Left and Right sides).
Photographs and Illustrations
Pictures and realistic drawings may be less data-oriented but need good language skills to describe them. The picture could be a photograph of an auditorium, a catastrophe, a landmark from history, or even a laboratory equipment. Without any figures to consider, pay attention to:
- The central item in the foreground.
- The background items and where they are located.
- Color, shape, texture, or the mood of the picture.
- The theme or context of the picture.
Mixed Data Visuals
At times, the PTE test may have two visual types in one question. Some examples of two visual types in one question could be bar graph and table, pie chart and line graph, among others. Here is how to tackle visuals when there are two of them without being intimidated:
- State the two visual types in the introduction part.
- Pick one main feature or highest value of the first visual type.
- Pick one main feature or highest value of the second visual type.
The Universal PTE Describe Image Template That Works for Any Image
The use of templates is the best way for ensuring yourself high marks in PTE Describe Image tasks. Template helps avoid all the uncertainties, provides the logical structure and makes you concentrate only on your pronunciations and fluency during your pte describe image questions test.
PTE Magic specialists created an universal template for any image – starting from complex graphs and ending with photos.
[Introduction]
The given image presents a detailed and informative layout about [Title/Overall Topic].
[Body – Key Feature 1]
An analysis of the visual reveals that the highest value/most significant feature is associated with [Category A], which stands at approximately [Value/Detail].
[Body – Key Feature 2]
In contrast, the lowest value/least significant element is observed in [Category B], showing a figure of [Value/Detail].
[Body – Additional Detail]
Furthermore, it is clear that other notable categories mentioned in the image include [Category C] and [Category D].
[Conclusion]
In conclusion, the image provides crucial insights regarding [Topic], illustrating a clear trend/structure across the entire data set.
Why This Universal Template Works
The template is effective because it is very well structured and employs advanced vocabulary. Such phrases as “informative arrangement,” “visual analysis,” and “significant feature” reflect an excellent understanding of academic language.
Moreover, the template is very flexible. In case you are discussing a photo without numerical value, it will be easy for you to replace “highest value” with “most significant feature” and “lowest value” with “background element.”
Sample Answers for Different PTE Describe Image Questions
Sample 1 – Bar Chart
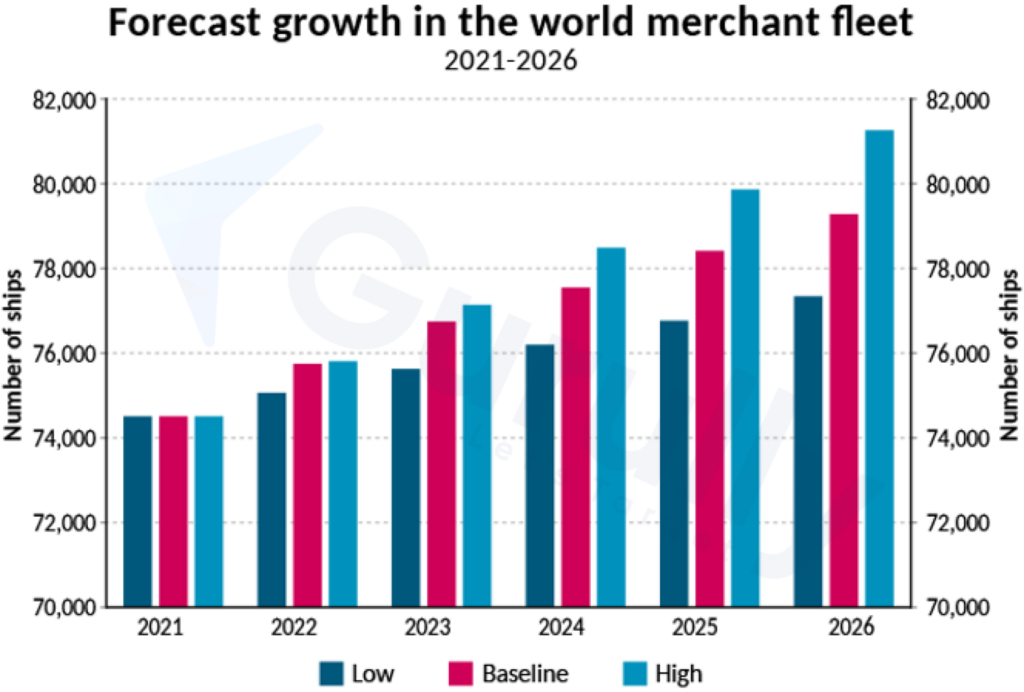
The bar chart depicts predictions for the world merchant fleet from 2021 to 2026 for three different scenarios-low, baseline, and high. Generally, all the scenarios depict an increasing trend in the six years ahead. In the year 2021, the number of ships stands at about 74,500 for all scenarios. For all subsequent years starting from 2022, the high prediction shows a faster rate of growth and is the highest. The baseline scenario shows modest growth, and the low scenario shows slow growth. By 2026, the merchant fleet is forecasted to reach above 81,000 ships for the high scenario and 79,000 and 77,000 ships for the baseline and low scenarios respectively.
Sample 2 – Line Graph
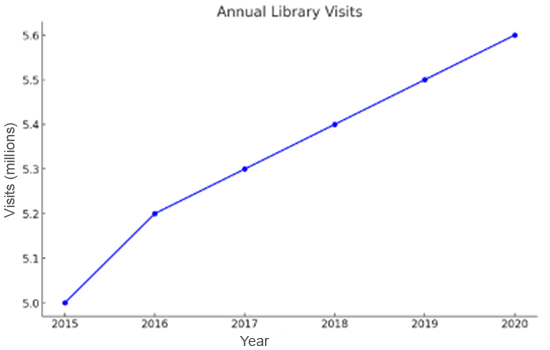
The line graph illustrates the number of annual library visits between 2015 and 2020. It starts at five million visits in 2015 and keeps increasing during the whole period. By 2016, there are about 5.2 million visits, and they keep growing until they reach 5.6 million in 2020. This steady growth means that the use of the library is becoming more and more popular each year. In general, the graph shows constant growth in the use of libraries.
Sample 3 – Pie Chart
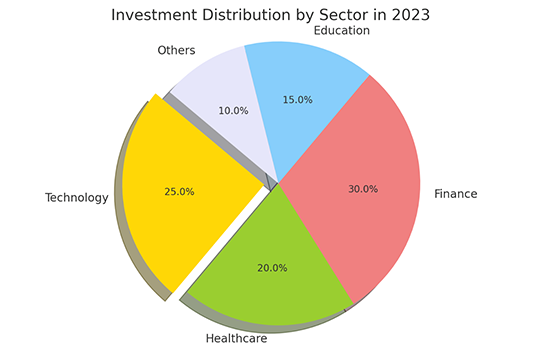
Pie chart shows how the investments have been distributed among various industries in 2023. The biggest slice is made up of Finance industry with 30%, then Technology industry and Healthcare industry each take up 25% and 20%, respectively. 15% goes to the Education industry, while all others occupy the remaining 10%.
Sample 4 – Process Diagram
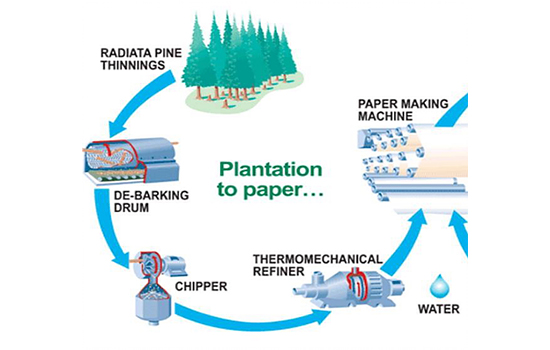
The figure above displays how paper is made from the tree. From the diagram, it is clear that the tree goes through various stages like the debarking drum, chipper, thermomechanical refiner, and paper maker. In the end, the trees are made into paper. Thus, the diagram displays how paper is made from the tree step by step.
Sample 5 – Photograph
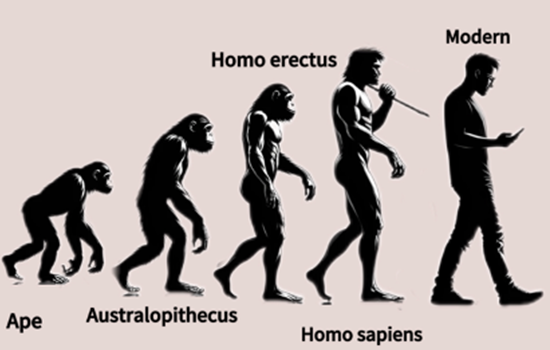
As evident from the image, the human beings have evolved over time, starting from an ape and becoming the current man. The stages involved in their evolution include Australopithecus, Homo erectus, and Homo sapiens. During each stage, one realizes that there is a growth in the height of the humans and that they adopt an upright posture. In the last stage, the current man uses a mobile phone.
Key Lessons From All Examples
An examination of these varied approaches to visual interpretation shows that there are three important facts about how one needs to go about answering a pte describe image question for achieving high scores:
- Pace Is Paramount Over Precision: It is crucial to keep talking. If you make any pronunciation mistake, it is very important that you disregard it and carry on. The automated marking scheme deducts points much more for pauses, hesitations, and corrections than mistakes in phonetics.
- Present Statistics in Simple Terms: Making efforts to give perfect numerical details can hinder smooth speaking. Saying statistics in terms of approximations is always beneficial in maintaining a steady stream of speech without adding to your mental effort.
- Adopt a Systematic Approach: A pre-decided structure of answer will help ensure smooth delivery without any pause in the midst.
Strategies to Score Higher in PTE Describe Image
Utilize Your 25-Second Preparing Time
While you prepare for 25 seconds, you are supposed to read the title of the picture fast to prepare your voice for pronunciation and to recognize the maximum and minimum numbers. It is not required to examine complicated data changes; you just need to choose two or three labels that you can pronounce correctly. Such a systematic approach helps you avoid getting scared and deliver your answer fluently as soon as the microphone becomes open.
Stick to a Steady Pace
It is important to stick to a steady pace ranging from 120 to 140 words per minute to be sure that you will get good results in terms of your oral fluency and pronunciation. Speaking too fast usually causes mispronunciation, while slow pronunciation might make your voice sound mechanical. You need to imagine that you are describing the picture to your co-worker sitting by your side.
Do Not Pay Attention to Minor and Complicated Aspects
The scoring tool does not estimate your ability to comprehend complicated trends; it estimates your ability to speak about them. Thus, you should ignore minor ups and downs of lines in the graph because the only thing that really matters for you is the overall trend and extremums. Think about your visual as about a simple story with a beginning, middle, and end to make things easier for yourself.
Focus on Key Words
Given that your content score depends on how many key words you use, you need to pay attention to the words in the title, axes, and legends. If you articulate major words and categories correctly, your AI algorithm will be able to recognize all necessary elements. For example, if your visual is devoted to a particular topic, it would be nice to repeat major terms several times.

Boost your PTE Describe Image score with these 4 proven strategies for maximum oral fluency.
How to Practice PTE Describe Image Effectively
Practice With Actual Test Graphics
Do not waste your time with any fake graphics, just use those which are really actual exam memories. Pte describe image questions test guarantees that you will be ready for the visual structure, titles, and complexity of information that you will have to work with during the actual exam.
Use Scoring Algorithm by Magic
A human coach cannot give you objective results, which are necessary for mastering the automatic oral exam. The interactive magic program provides you with an opportunity to check yourself using an algorithmic scoring simulation, which checks your fluency, pronunciation, and key points instantly. Thus, you can see all your mistakes in phonetics and fix them fast.
Learn from Expert Coaches
In addition to feedback from the AI, getting your speaking skills reviewed by expert coaches will help you get better much faster. Our expert coaches at PTE Magic, located in Vietnam and Australia, will guide you to refine your intonation, fix pronunciation mistakes, and be confident enough to score a perfect 90/90.
Conclusion
Being able to tackle pte describe image questions is more about technique than about being fluent in the language itself. Through using our universal template, being fluent in pronunciation, and training on real images, you will be sure to get full marks for this difficult section.
You should not leave your PTE score up to fate. Get access to our large question database, train with our AI scorer, and get personalized tips from professionals.
FAQ
How many Describe Image questions appear in the PTE exam?
There will be around 3-4 Describe Image questions in the PTE Speaking & Writing section. For each question, you will have 25 seconds for preparation and then 40 seconds to give an answer through speech.
Is fluency more important than content in PTE Describe Image?
Yes, in the PTE academic test which is conducted on a computer, both Oral Fluency and Pronunciation play an extremely important role. If you keep pausing here and there in order to make sure that your content is 100% correct, your score will suffer greatly. It is much better to speak fluently with simplified content.
Can I use the same template for every Describe Image question?
Absolutely. It’s possible to use the same universal Describe Image template for all kinds of images, whether it is a bar chart, line graph, pie chart, map, flowchart or a photograph. By using one template, you won’t have problems with hesitation and will be able to speak fluently in all questions.
What is a good score for PTE Describe Image?
In order to get a good score, you need to score a perfect 5/5 in both Oral Fluency and Pronunciation and get 3 or 4 out of 5 in Content. To achieve these scores in Describe Image questions, you need to get a Speaking Score of 79+ (IELTS Band 8.0).